
antigenic variants of influenza A virus
1. What is the antigenic variant for influenza virus?
Antigenic variant is defined as the virus which has distinct antigenicity with some other virus. Therefore, if virus A is predicted as antigenic variant of virus B, it could escape the immunity generated against virus B.
2. What is the antigenic correlation network (ACnet)?
It reflects the antigenic relationship between viruses. Only if two viruses are predicted to be antigenic similar, they are connected in the network.
3. How to change the visual style of the ACnet?
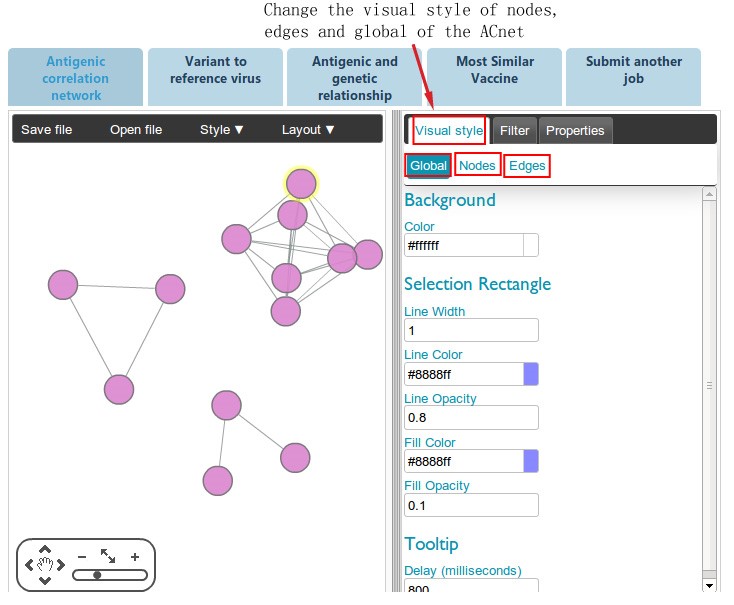
The ACnet was displayed in the flash version of Cytoscape. Its visual style could be changed in an easy way as shown in the figure below. Either the global style or the node and edge styles could be changed by the user, such as the color and shape of the nodes.
4. How to predict the antigenic variant for influenza A virus based on HA1 protein sequence?
The method used here was a naive Bayes classifier, which incorporate 17 structural and physicochemical properties or features that have been reported to or are thought to affect the antigenic properties of influenza HA. These 17 features include ten artificial sites on HA1 protein (defined based on the distance of amino acids to the top of HA1 protein), five physicochemical properties of amino acids (hydrophobicity, volume, charge, polarity and ASA), receptor binding and glycosylation. For a given pair of viruses, the values for the 17-feature variables were calculated based on their HA1 sequences(1-320 aa). The model output an odds ratio for a given pair of viruses. It denotes the extent of antigenic variation between them. If the odds ratio is equal to or greater than 1, the antigenic relationship of the two viruses is regarded as antigenically distinct, otherwise as antigenically similar. The greater the odds ratio is, the more likely it is that the two viruses are antigenically similar.
5. What’s the dataset used for training the model?
The HA-inhibition (HI) dataset was used to train the model for prediction of antigenic variant of influenza A virus. It was collected from relevant literatures and documents published by the collaborating centers of the WHO's global influenza surveillance network. Then, the Archetti-Horsfall distance (dAH) was used to measure the antigenic characteristics between viral strains. It was calculated as follows: dAH=sqrt(Hii*Hij/(Hij*Hji)) , where Hij refers to the HI titer of strain i relative to antisera raised against strain j. When the dAH of a pair of strains was measured in several independent HI assays, the median was used of all dAH calculated from these independent assays. The threshold for dAH distance was defined to be 4. When the dAH is equal to or greater than the threshold, the pair of vaccine strains was considered as antigenic variant pair; otherwise antigenic similar pair. Using the dAH measure, we derived a total of 355, 791, 293 and 118 pairs of viral strains for influenza H1N1, H3N2, H5N1 and H9N2 viruses. They were used to build the computational model.
6. What’s the difference between the models provided in Step4 of the server?
Their differed in the antigenic data used to train the models. The model of “Combination” used all the antigenic data of influenza H1N1, H3N2 and H5N1 viruses, while the model of “H1N1”, “H3N2” and “H5N1” use the antigenic data of individual subtypes.
7. What does the odds ratio mean?
The odds ratio measures the extent of antigenic difference between viruses. It is a semi-quantitative measure. If the odds ratio is equal to or greater than 1, the antigenic relationship of the two viruses is regarded as antigenically distinct, otherwise as antigenic similar. The greater the odds ratio is, the more likely the two viruses are antigenically distinct. If the number of amino acid differences between a pair of viruses is greater than 15, they are very likely to be antigenically distinct with a probability over 0.9. Therefore, we didn’t calculate the odds ratio for them. If the number of amino acid difference between a pair of viruses is less than 3, they are very likely to be antigenically similar with a probability over 0.9. Therefore, we didn’t calculate the odds ratio for them and output a "Min" instead of the predicted odds ratio. Besides, if the predicted odds ratio for a pair of viruses is equal to 0, it is also replaced with a "Min".
8. How to derive the structure of the HA subtypes with no crystal structure solved in Protein Data Bank (PDB)?
Except for H4, the trimer structure of H8, H11, H12, H14 and H15 were derived throuth Homology modeling with the help of MODELLER (available at https://salilab.org/modeller/). The structures of the most similar HA subtype to these subtypes were used as template in the homology modeling. The structure of H4 (2FHV), which was also derived through homology modelling by Spiga et al., was downloaded from PDB.
9. Related work to this web server by our lab!
1 Peng YS, Zou YQ, Li HL, Li KL, Jiang TJ. Inferring the antigenic epitopes for highly pathogenic avian influenza H5N1 viruses. Vaccine (2013) 10.1016/j.vaccine.2013.12.005.
2 Du, X., et al. (2012). "Mapping of H3N2 influenza antigenic evolution in China reveals a strategy for vaccine strain recommendation." Nat Commun 3: 709.
3 Li Honglei, Peng Yousong*, Zou Yuanqiang, Huang Zechi, Wu Aiping, Li Kenli, Jiang Taijiao*, PREDAC-H5: A User-friendly Tool for the Automated Surveillance of Antigenic Variants for the HPAI H5N1 Virus, Infection,Genetics and Evolution (2014), doi: http://dx.doi.org/10.1016/j.meegid.2014.08.030
4 Liu M, Zhao X, Hua S, et al. Antigenic Patterns and Evolution of the Human Influenza A (H1N1) Virus[J]. Scientific reports, 2015, 5.
5 Hua S, Li X Y, Liu M, et al. Antigenic variation of the human influenza A (H3N2) virus during the 2014–2015 winter season[J]. Science China Life Sciences, 2015, 58(9): 882-888.
10. How to cite us?
If you use this web server in your work, please cite us as the following: Peng YS, Jiang TJ, et al. PREDAV-FluA: a universal computational model for predicting the antigenic variants of influenza A virus.